
Friday, 4 November 2011
Technical charts
Thursday, 3 November 2011
Technical charts

Monday, 31 October 2011
Technical charts

Friday, 28 October 2011
Technical charts

Tuesday, 25 October 2011
Technical charts

Monday, 24 October 2011
Technical charts

Thursday, 20 October 2011
Technical charts

Wednesday, 19 October 2011
Technical charts

Tuesday, 18 October 2011
Technical charts

Monday, 17 October 2011
Technical charts

Friday, 14 October 2011
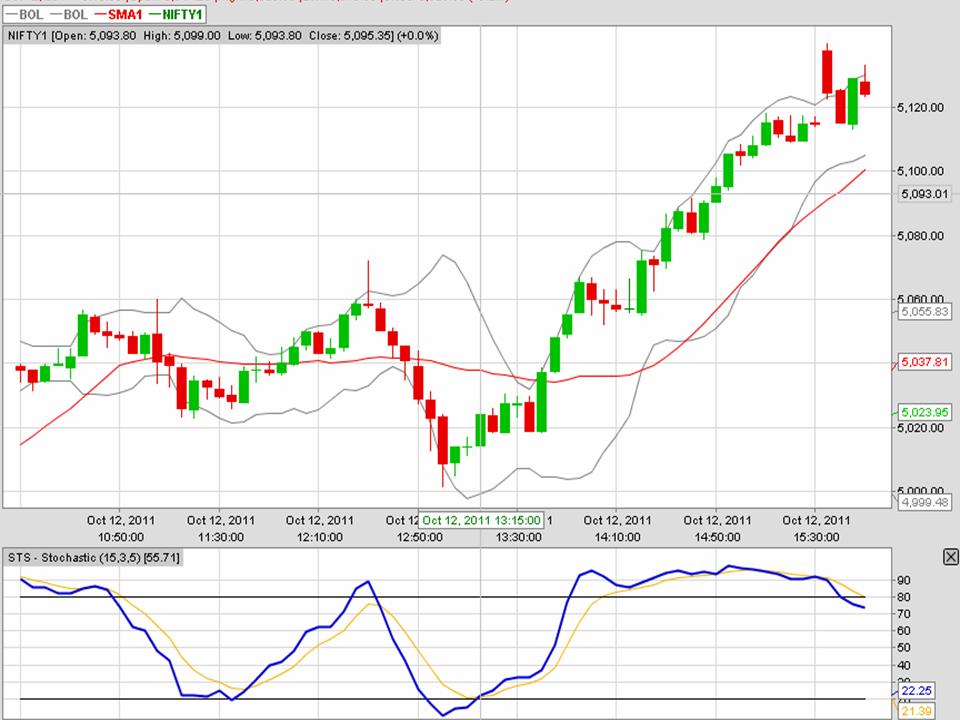
 The Stochastic levels on 13-10-2011 day high was at 93.32 and day low was at 2.62.
Thursday, 13 October 2011
Technical charts
Wednesday, 12 October 2011

Monday, 10 October 2011
Technical charts

Friday, 7 October 2011

Wednesday, 5 October 2011

Tuesday, 4 October 2011

Monday, 3 October 2011
Technical charts

Wednesday, 28 September 2011
 the Stochastic day high on 27-09-2011 was 92.4 and day low was at 47.08
Tuesday, 27 September 2011

Monday, 26 September 2011

Friday, 23 September 2011

Thursday, 22 September 2011
Technical charts

Wednesday, 21 September 2011
Technical charts

Monday, 19 September 2011
Technical charts

Friday, 16 September 2011
Technical charts

Thursday, 15 September 2011

Wednesday, 14 September 2011

Tuesday, 13 September 2011

Monday, 12 September 2011

Tuesday, 23 August 2011


Sunday, 21 August 2011

Thursday, 18 August 2011

Wednesday, 17 August 2011
Subscribe to:
Posts (Atom)